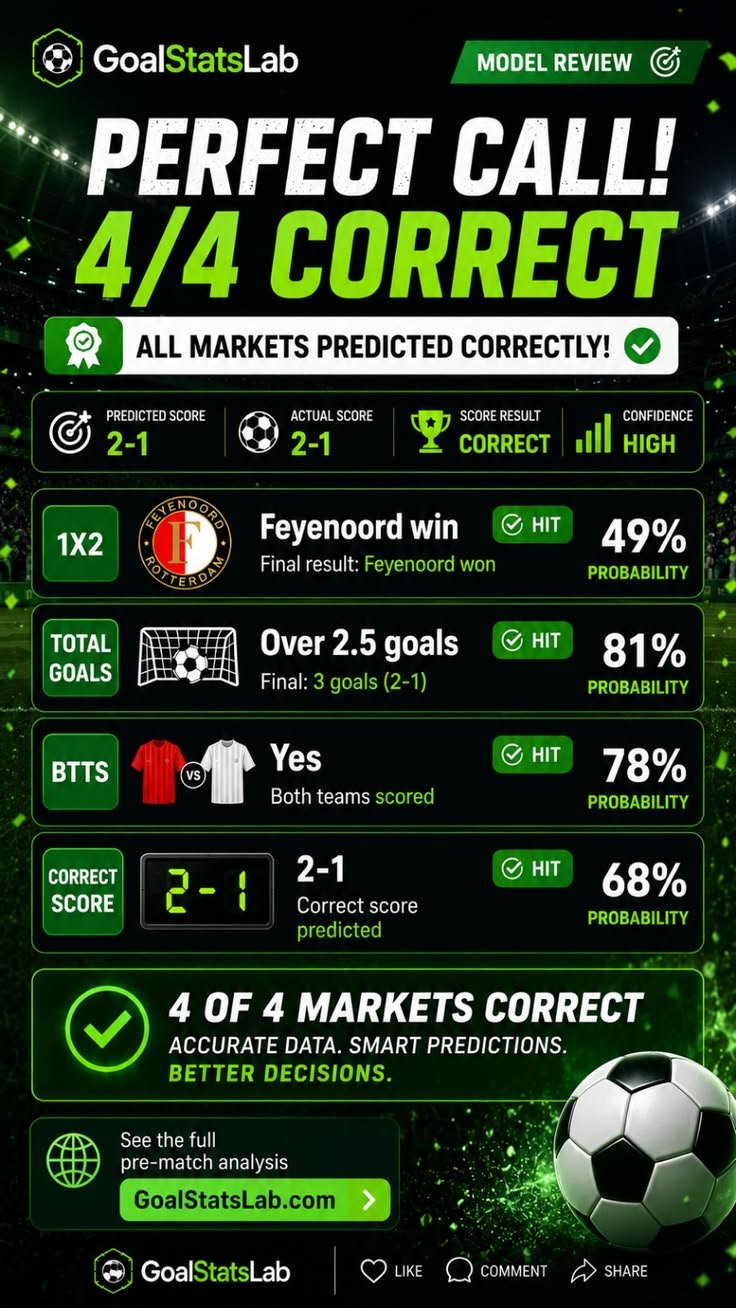
Team statistics are an important part of modern football analysis. They provide numerical information about how a football team performs during matches, across a season, or in a specific competition.
By analyzing goals, wins, possession, shots, passes, defensive actions, and other metrics, fans can better understand the strengths and weaknesses of a team.
What Are Football Team Statistics?
Football team statistics are data that describe the performance of a club or national team.
These statistics can cover different areas of the game, including:
- Attacking
- Passing
- Defending
- Possession
- Discipline
- Results
- Goalscoring
Team statistics can be shown for a single match, a season, a competition, or a historical period.
Why Are Team Statistics Important?
The final score only provides one part of the story.
A team may win a match while having less possession, while another team may create more shots but fail to score.
Team statistics provide additional information that can help fans understand how matches were played.
Important Football Team Stats
Some of the most common team statistics include:
| Statistic | Description |
|---|---|
| Matches Played | Number of matches played |
| Wins | Matches won |
| Draws | Matches ending level |
| Losses | Matches lost |
| Goals Scored | Total goals scored |
| Goals Conceded | Total goals allowed |
| Goal Difference | Goals scored minus goals conceded |
| Clean Sheets | Matches without conceding |
| Possession | Percentage of ball possession |
| Shots | Total shooting attempts |
| Shots on Target | Shots directed toward the goal |
| Passes | Number of passes |
| Passing Accuracy | Percentage of successful passes |
| Corners | Corner kicks won |
| Cards | Yellow and red cards |
Attacking Team Statistics
Attacking statistics help measure how effectively a team creates and finishes scoring opportunities.
Important attacking metrics include:
- Goals scored
- Shots
- Shots on target
- Big chances
- Chances created
- Expected goals (xG)
- Goals per match
- Conversion rate
For example, a team that scores 50 goals in 25 matches has an average of:
50 ÷ 25 = 2 goals per match
This provides a simple way to measure scoring output.
Defensive Team Statistics
Defensive statistics show how well a team prevents opponents from creating and scoring chances.
Common defensive metrics include:
- Goals conceded
- Clean sheets
- Tackles
- Interceptions
- Clearances
- Blocks
- Recoveries
- Defensive errors
A team that regularly keeps clean sheets may have a strong defensive record, although several statistics should be considered together.
Possession Statistics
Possession measures the percentage of time a team controls the ball during a match.
For example:
| Team | Possession |
|---|---|
| Team A | 62% |
| Team B | 38% |
Possession can provide information about how much a team controlled the ball, but it does not by itself determine which team created more scoring opportunities.
Passing Statistics
Passing statistics are widely used in football analysis.
They can include:
- Passes attempted
- Passes completed
- Passing accuracy
- Forward passes
- Long passes
- Crosses
- Through balls
For example, if a team completes 450 passes out of 500 attempts:
450 ÷ 500 × 100 = 90% passing accuracy
Home and Away Team Statistics
Team performance can be separated into home and away matches.
A statistics website might show:
| Statistic | Home | Away |
|---|---|---|
| Matches | 15 | 15 |
| Wins | 10 | 6 |
| Draws | 3 | 4 |
| Losses | 2 | 5 |
| Goals | 32 | 21 |
This makes it easier to study differences between home and away performances.
Team Form Statistics
Recent team form is another useful area of football statistics.
A team may have a record such as:
W – W – D – L – W
Where:
- W = Win
- D = Draw
- L = Loss
Team form is often displayed using the most recent matches and can be combined with goals scored and conceded.
Head-to-Head Team Statistics
Head-to-head statistics show how two teams have performed against each other in previous matches.
A head-to-head section can include:
- Previous results
- Wins for each team
- Draws
- Goals scored
- Goals conceded
- Recent meetings
This information can help fans explore the history between two teams.
Team Statistics by Season
Season statistics allow fans to track a team’s performance over an entire campaign.
A season summary can include:
| Statistic | Total |
|---|---|
| Matches | 38 |
| Wins | 24 |
| Draws | 8 |
| Losses | 6 |
| Goals Scored | 72 |
| Goals Conceded | 35 |
| Clean Sheets | 15 |
This provides a useful overview of the team’s overall performance.
Advanced Team Statistics
Modern football analysis also uses advanced metrics.
Examples include:
- Expected Goals (xG)
- Expected Goals Against (xGA)
- Expected Assists (xA)
- Progressive passes
- Progressive carries
- Pressing statistics
- Shot-creating actions
- Possession in the final third
These metrics can provide deeper information about team performance than traditional statistics alone.
Comparing Football Teams
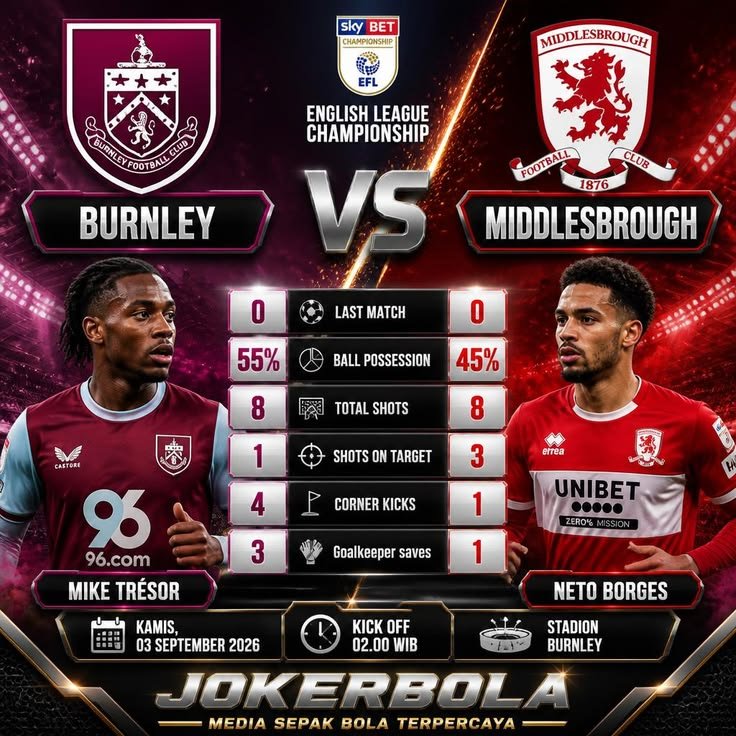
Team statistics can be used to create detailed comparisons.
For example:
| Statistic | Team A | Team B |
|---|---|---|
| Goals | 60 | 52 |
| Goals Conceded | 30 | 35 |
| Possession | 57% | 51% |
| Shots Per Match | 15 | 12 |
| Clean Sheets | 14 | 11 |
| Passing Accuracy | 88% | 84% |
Such comparisons allow fans to examine different aspects of team performance without relying only on match results.
Team Statistics for Football Websites
A football statistics website can organize team data into dedicated team pages.
A useful team profile can include:
- Current standings
- Fixtures
- Results
- Recent form
- Goals
- Player statistics
- Home and away records
- Head-to-head information
- Season statistics
- Historical records
This makes it easier for users to find all important information about a club in one place.
Conclusion
Team statistics provide a detailed way to analyze football teams. Goals, wins, possession, shots, passing, defensive actions, clean sheets, and advanced metrics can all help explain team performance.
For football fans and statistics websites, combining team stats, player stats, fixtures, results, standings, and head-to-head records creates a more complete picture of the game.